Multi-Day Concentration Risk: Track Persistent Exposure
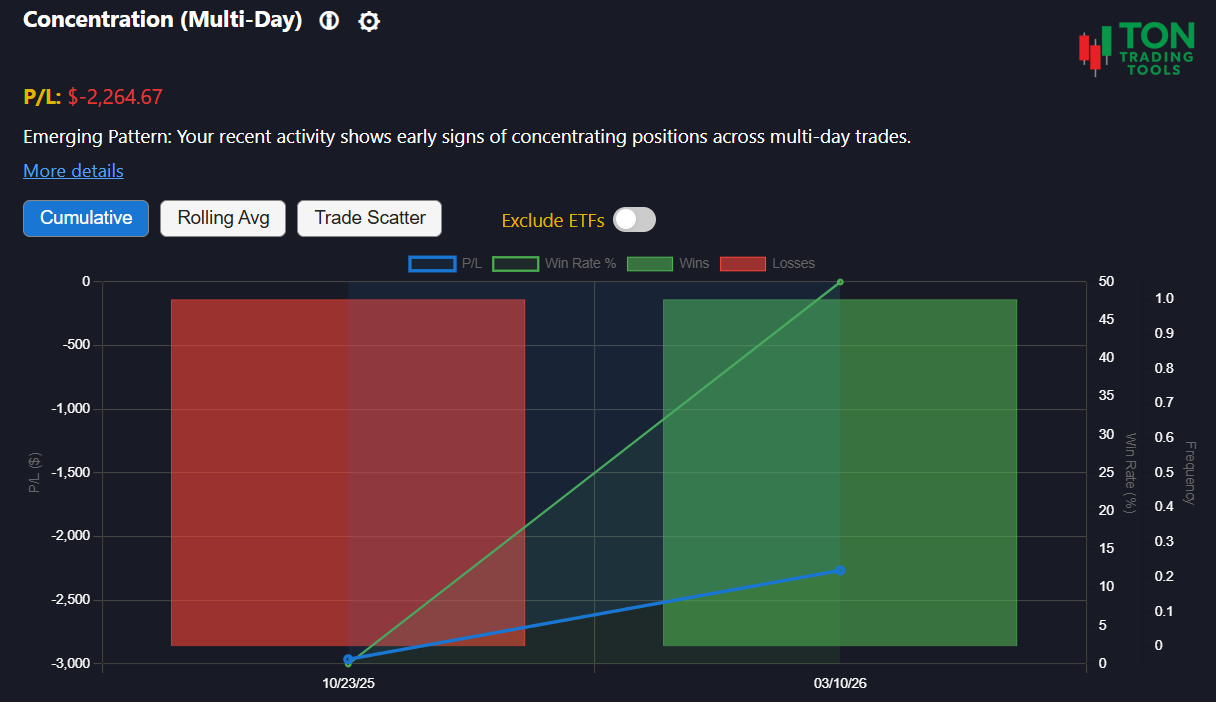
The Multi-Day Concentration Risk Pattern tool is built for Thinkorswim users who want to understand if their risk is concentrated in a single stock across multiple days. Are you holding or trading the same symbol day after day? This tool analyzes your trade history to reveal when your exposure persists, helping you spot both emerging and established concentration risk.
This is not a charting or technical analysis tool. Instead, it focuses on your real trading decisions�highlighting periods where your capital is repeatedly allocated to the same stock over several sessions. Use these insights to diversify, manage risk, and avoid the pitfalls of over-concentration.
Wondering how to track profit and loss across multi-day trades? The tool supports FIFO (First-In, First-Out) calculation and trade matching, making it easy to audit your realized P&L even when positions span multiple days.
For a broader view of your risk, try our Volatility Based Risk Calculator or explore related patterns like Intraday Concentration Bias and Symbol Attachment Bias.
How Multi-Day Concentration Detection Works
Pattern Detection
- Identifies periods where your exposure to a single stock persists across multiple days
- Analyzes your activity over a 90-day lookback window
- Classifies your pattern as Emerging, Confirmed, or Strong
Pattern Strength
- Emerging Pattern: 3+ consecutive days of concentrated exposure
- Confirmed Pattern: 7+ consecutive days of concentrated exposure
- Strong Pattern: 12+ consecutive days of concentrated exposure
Why It Matters
- Persistent concentration increases risk and can amplify losses
- Recognizing this pattern helps you diversify and protect your capital
- FIFO P&L calculation makes it easy to track realized gains and losses across multi-day trades
Supported Patterns & Related Tools
- Multi-Day Concentration Risk Pattern (this page)
- Intraday Concentration Bias Pattern
- Symbol Attachment Bias
- Volatility Based Risk Calculator
- Pattern Comparison Overview
Get Started Today
Ready to see if you have a multi-day concentration risk? Upload your Thinkorswim desktop trade files and let the Multi-Day Concentration Risk Pattern tool analyze your trading history. For best results, review your patterns at the end of each trading day.
FAQ
Frequently Asked Questions
Answers to common questions about the Multi-Day Concentration Risk Pattern tool for Thinkorswim desktop.

The tool uses FIFO (First-In, First-Out) logic to match trades and calculate realized P&L, even when positions are opened and closed over several days. This makes it easy to audit your results and understand your true performance.
Currently, the Multi-Day Concentration Risk Pattern tool supports stocks only. Support for additional instruments may be added in the future.
Concentrating risk in a single stock over multiple days can amplify losses and reduce flexibility. Recognizing this pattern helps you diversify and manage your exposure more effectively.
For intraday concentration analysis, use the Intraday Concentration Bias Pattern tool, which focuses on single-session risk.