Symbol Attachment Bias: Recognize and Break Recurring Trading Habits
The Symbol Attachment Bias Pattern tool is designed for Thinkorswim desktop users who want to improve their trading discipline and diversification. Are you trading the same stock for several days in a row, even without a clear catalyst? This tool analyzes your trade history to reveal when you may be developing an emotional attachment to a symbol, helping you spot both emerging and established patterns in your trading.
This is not a chart analysis tool. Instead, it focuses on your actual trading decisions highlighting days when you repeatedly trade the same symbol across consecutive sessions. The tool intelligently ignores legitimate catalysts, such as high activity or volatility, so you can focus on true behavioral patterns.
For a deeper understanding of risk and trading discipline, try our Volatility Based Risk Calculator or explore Concentration Bias Pattern to further manage your exposure and habits.
How Pattern Comparison Works
Pattern Detection
- Identifies days when you trade the same symbol for 3 or more consecutive days
- Ignores periods with legitimate catalysts (e.g., high activity or volatility)
- Tracks your activity over a 90-day lookback window
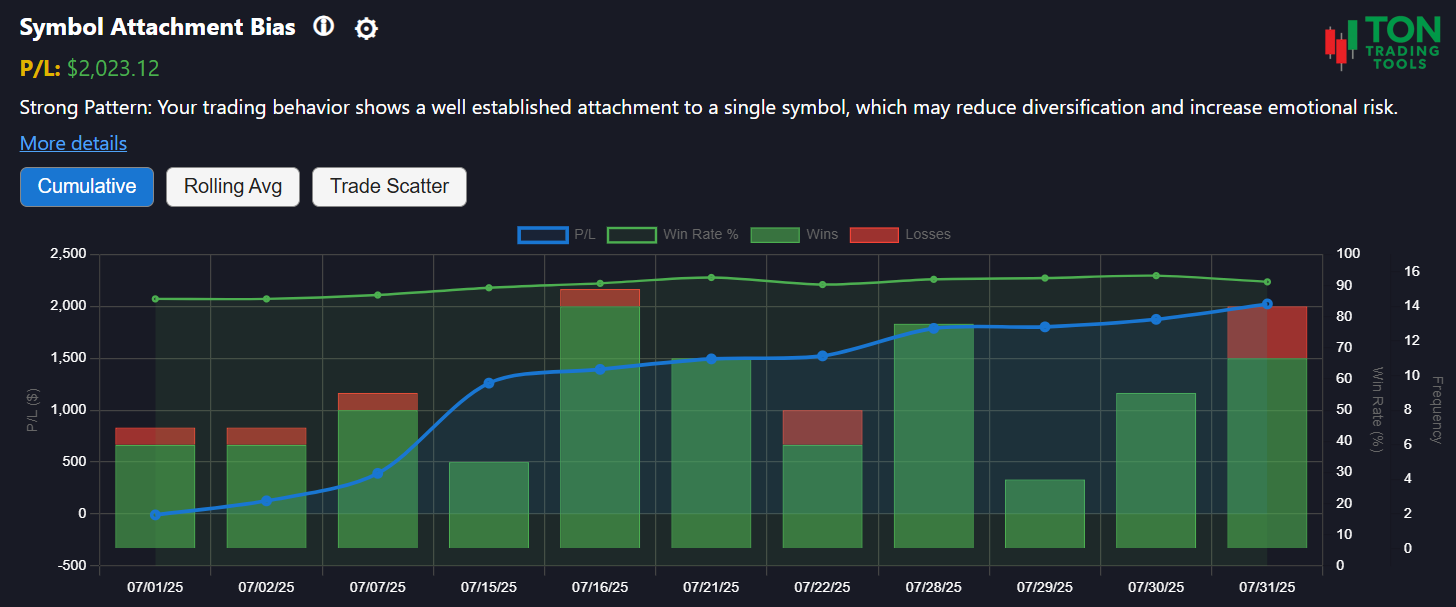
- Classifies your pattern as Emerging, Confirmed, or Strong
Pattern Strength
- Emerging Pattern: 2+ consecutive days trading the same symbol
- Confirmed Pattern: 5+ consecutive days trading the same symbol
- Strong Pattern: 8+ consecutive days trading the same symbol
Why It Matters
- Repeatedly trading the same symbol can reduce diversification and increase emotional risk
- Recognizing attachment bias helps you manage risk and improve results
- Combine with Volatility Based Risk Calculator and Concentration Bias Pattern for a complete risk profile
Supported Patterns & Related Tools
- Symbol Attachment Bias (this page)
- Concentration Bias Pattern
- Volatility Based Risk Calculator
- Pattern Comparison Overview
Get Started Today
Ready to see if you have a symbol attachment bias? Upload your Thinkorswim desktop trade files and let the Symbol Attachment Bias Pattern tool do the rest. For best results, review your patterns at the end of each trading day.
FAQ
Frequently Asked Questions
Answers to common questions about the Symbol Attachment Bias Pattern tool for Thinkorswim desktop.

This tool analyzes your Thinkorswim desktop trade history to detect periods when you trade the same symbol for multiple consecutive days, helping you spot and manage attachment bias.
No, this is not a chart analysis tool. It focuses on your actual trading decisions and behavioral patterns, not technical chart setups.
The Symbol Attachment Bias Pattern tool is currently available only for Thinkorswim desktop users.
Repeatedly trading the same symbol can increase emotional risk and reduce diversification. Use this tool alongside the Volatility Based Risk Calculator and Concentration Bias Pattern to better understand and manage your exposure.