Intraday Risk Management: The Complete Picture
In today's volatile trading environment, managing intraday risk isn't just a precaution it's essential for sustained profitability. Our comprehensive dashboard empowers traders with visibility into both risk exposure and profit generation simultaneously. By tracking maximum intraday dollar positions alongside percentage-based risk metrics, you gain complete awareness of your portfolio's health throughout the trading day.
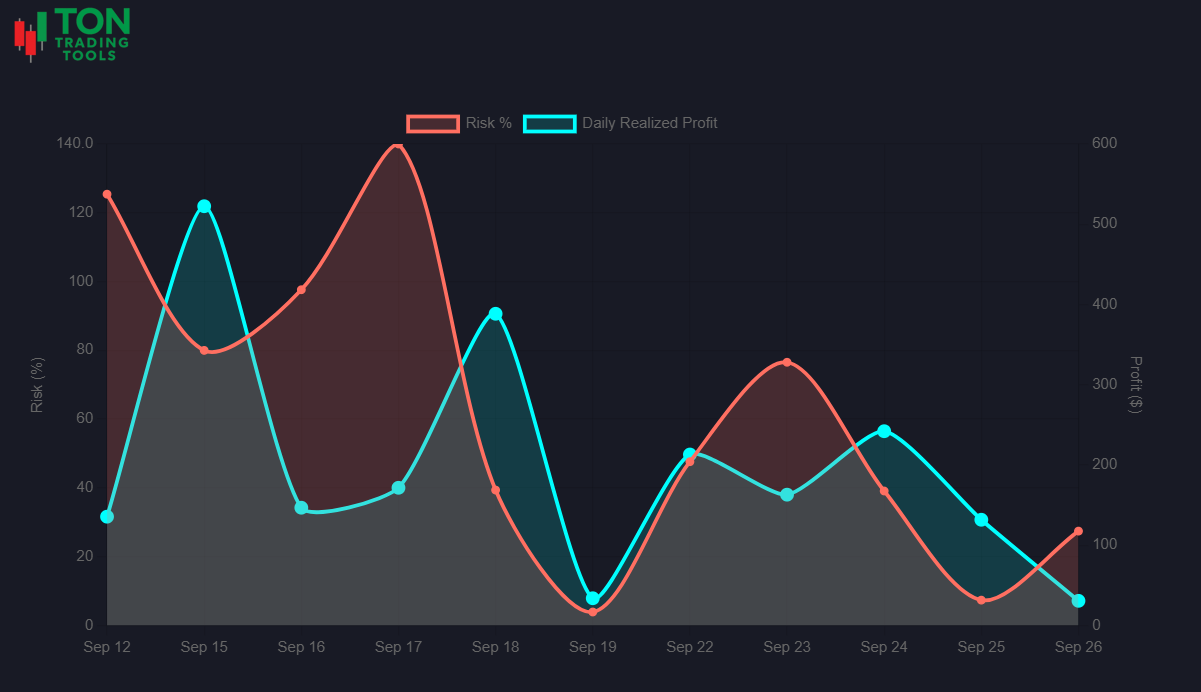
Traditional risk management tools only tell half the story by focusing solely on potential losses. Our solution provides the complete picture showing both risk AND profit metrics side-by-side. This dual perspective enables smarter decision-making, helps optimize position sizing, and ultimately leads to more consistent trading performance.
The dashboard's time-based insights give you precise estimates for position liquidation at different levels (50%, 75%, and 100%), allowing you to plan exit strategies before market conditions change. Our flexible analysis tools let you toggle between chart and table views, customize time periods, and quickly identify which symbols consistently create the highest risk exposure.
Key Benefits
Complete Visibility
- Track maximum intraday dollar exposure across all positions
- Monitor risk as a percentage of your total account balance
- View profit/loss in for each position
- Identify concentration risk in specific symbols instantly
Time-Based Insights
- See exactly how long it would take to close positions at different levels
- Plan exit strategies before market conditions change
- Make informed decisions about position sizing based on liquidity data
- Anticipate potential bottlenecks in high-volume trading situations
Flexible Analysis
- Toggle between chart and table views
- Customize time periods to spot trends across days, weeks, or months
- Interactive charts with hover tooltips for detailed information
- Color-coded profit/loss indicators for instant recognition
Real Solutions for Real Traders
- Clear visual indicators showing your highest exposure positions
- Side-by-side profit and risk metrics for informed decision making
- Precise time-to-close estimates at multiple percentage levels
- Responsive design that works on any device
Why Both Risk AND Profit Matter
Most risk management tools focus solely on potential losses, creating an incomplete picture of your trading activity. Our dashboard bridges this gap by displaying both sides of the equation, helping you understand not just what you could lose, but what you're gaining through your risk exposure.
| What Traditional Tools Show | What Our Dashboard Provides |
|---|---|
| Only risk metrics | Risk AND profit side by side |
| Static snapshots | Dynamic intraday tracking |
| Limited context | Complete position closure estimates |
| Fixed timeframes | User-adjustable date ranges |
Advanced Features
Our risk dashboard goes beyond basic metrics to deliver actionable intelligence:
- Collapsible chart and table sections for a streamlined experience
- One-click toggles between visual and tabular data representation
- Automatic calculation of maximum intraday dollar exposure
- Precise risk percentage calculations based on your account balance
- Intelligent time estimates for position liquidation at various levels
- Color-coded indicators for instant profit/loss recognition
Get Started Today
Stop trading with limited visibility. Our comprehensive intraday risk management solution provides the complete picture you need to make informed decisions, optimize your strategy, and improve your overall trading performance. Contact us today to learn how our dashboard can transform your approach to risk management.
FAQ
Frequently Asked Questions
Answers to common questions about the Intraday Risk & Profit Dashboard.

It's a analytics tool that helps traders monitor both risk and profit exposure throughout the trading day, providing actionable insights for smarter decisions.
It tracks your largest positions, calculates risk as a percentage of your account, and estimates time to close positions at various levels, so you can act before risk becomes a problem.
Yes, you can adjust the time period to analyze trends across days, weeks, or months, and switch between chart and table views for flexible analysis.
Absolutely. Unlike traditional tools, our dashboard displays risk and profit side-by-side, so you always see the full picture of your trading performance.