Intra-Day Risk Dollar Report: Know Your True Exposure
The Intra-Day Risk Dollar Report gives you a fast, visual way to gauge your risk for any trading day. See exactly how much of your account balance was at risk with cash or margin. This tool makes it easy to hold yourself accountable as you scale up, helping you avoid overexposure and stay disciplined.
Risk is shown as a percentage of your account balance. If you see 50%, it means you used half your available account for that position. If you use margin, you might see 200% or more instantly showing you when you assumed extra risk. This is the easiest way to track your risk exposure and make smarter decisions as you grow.
Whether you're trading small or scaling up, the Intra-Day Risk Dollar Report helps you understand your true exposure, compare risk across symbols, and improve your process. No more guessing just clear, actionable data at the end of every day.
Key Benefits
Quick Risk Assessment
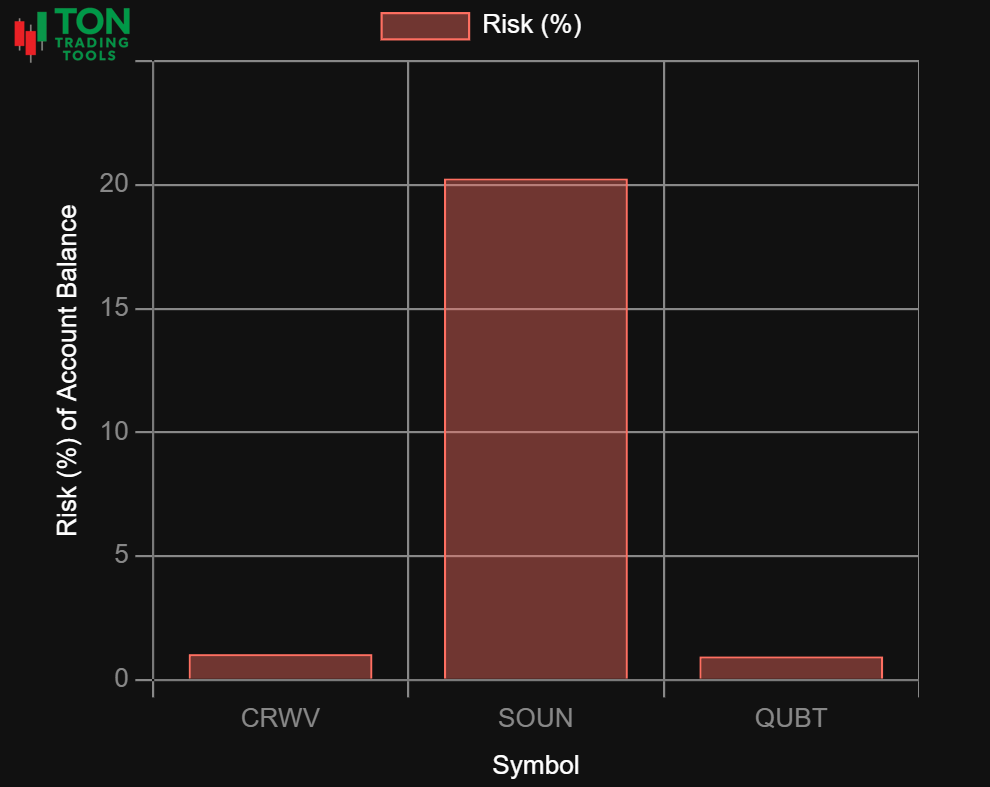
- See risk as a percentage of your account balance for every symbol
- Instantly spot when you used margin or took on extra exposure
- Hold yourself accountable as you scale up
- Track risk for every position, every day
Actionable, Simple Reporting
- Color-coded charts and tables for instant clarity
- Collapse/expand views for focused analysis
- Compare risk across symbols and days
- Perfect for end-of-day review and journaling
Designed for Real Traders
- Responsive design for desktop and mobile
- Integrates with your trading journal and analytics
- Built for day traders, swing traders, and investors alike
- Simple, intuitive interface no learning curve
Why Track Risk as a Percentage?
Most platforms only show dollar amounts, making it hard to see your true exposure. By tracking risk as a percentage of your account balance, you get instant context so you know when you're pushing your limits or staying disciplined. This is critical for building consistency and avoiding costly mistakes as you grow.
| What Brokers Show | What Our Risk Report Provides |
|---|---|
| Raw dollar amounts | Risk as a percentage of account balance |
| No context for margin usage | See when you used margin and how much risk you assumed |
| Hard to compare risk across symbols | Instant comparison for every position, every day |
| Manual tracking | Automated, visual reporting for end-of-day review |
Advanced Features
The Intra-Day Risk Dollar Report is more than just a summary it's a tool for real improvement:
- Risk shown as a percentage of account balance
- Margin usage instantly visible (e.g., 200% risk)
- Collapse/expand chart and table views
- Color-coded for fast review
- Integrates with your trading journal and analytics
- Responsive design for any device
- Simple, intuitive interface no training required
Get Started Today
Stop guessing about your risk exposure. The Intra-Day Risk Dollar Report gives you the clarity you need to make better decisions, improve your process, and achieve your trading goals. Contact us to see how this simple tool can transform your review process.
FAQ
Frequently Asked Questions
Answers to common questions about the Intra-Day Risk Dollar Report.

It's a reporting tool that shows your risk exposure as a percentage of your account balance, making it easy to track margin usage and hold yourself accountable.
If you see 50%, you used half your account for that position. If you see 200%, you used margin and took on extra risk. This makes it easy to see your true exposure.
Yes, you can instantly compare risk for every symbol and every day, helping you spot patterns and improve your process.
Absolutely. The risk report integrates with your trading journal and analytics, making it easy to connect your notes and review your risk exposure.