Daily Profit & Loss Calendar: Your Month, Visualized
Most brokerage platforms make it nearly impossible to see your daily performance at a glance. Our color-coded Daily Profit & Loss Calendar gives you a clear, detailed view of your trading results—day by day. Instantly spot your best and worst days, identify streaks, and focus on what truly matters for your trading process.
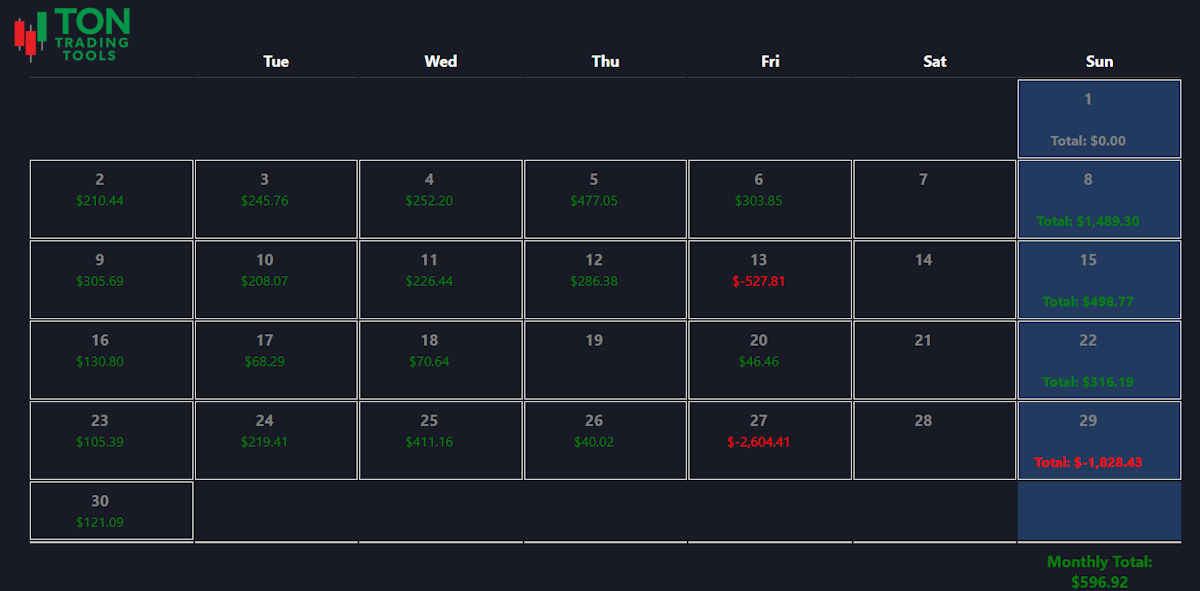
This daily calendar view is far more detailed than the Yearly Profit Calendar, letting you drill down into each day’s results. With toggles to switch between total daily profit and the largest quantity position of that day, you can quickly analyze which trades or symbols are driving your performance.
Each day is color-coded: green for profit, red for loss, gray for flat or missing data. This makes it easy to recognize patterns, outliers, and consistency at a glance—no spreadsheet required.
Key Benefits
Granular Daily Insights
- See your entire month’s P&L in a single, color-coded calendar
- Spot winning and losing streaks instantly
- Identify which days and symbols drive your results
- Drill down to the details that matter for your process
Flexible Analysis Modes
- Toggle between total daily profit and largest symbol profit/loss
- Focus on your best (or worst) trades with a single click
- Quickly review the impact of new strategies or discipline changes
- Eliminate guesswork—base your review on clear, objective data
Actionable, Simple Reporting
- No more digging through statements or spreadsheets
- Perfect for end-of-month reviews and tax preparation
- Works seamlessly with your trading journal
Designed for Real Traders
- Responsive design for desktop and mobile
- Integrates with your existing trading journal and reporting tools
- Built for day traders, swing traders, and investors alike
- Simple, intuitive interface—no learning curve
Why a Daily Calendar View Matters
Traditional brokerage statements make it hard to see the big picture, and even harder to spot daily patterns. Our daily calendar view brings your trading results to life, helping you understand not just what you made or lost, but when and how those results happened. This context is critical for improving your process and building consistency.
| What Brokers Show | What Our Calendar Provides |
|---|---|
| Endless tables and statements | Color-coded daily performance at a glance |
| No visual feedback | Instant recognition of daily trends and outliers |
| Hard to spot patterns | Easy to identify winning/losing streaks |
| Manual data crunching | Automated, visual reporting |
Advanced Features
Our Daily P&L Calendar is more than just a summary—it’s a tool for real improvement:
- Color-coded days for instant clarity
- Toggle between daily profit and largest symbol profit/loss
- Integrates with your trading journal for deeper analysis
- Responsive design for any device
- Simple, intuitive interface—no training required
- Journal Awareness: Each day with a saved daily log will show a small icon, making it easy to spot which days you’ve journaled and which days you may have missed. This helps you build consistency and never lose track of your end-of-day reflections.
Seamless Comparison: Instantly Review Performance Between Dates
The Daily Profit & Loss Calendar is tightly integrated with our powerful comparison tool. With just a couple of clicks, you can select any two dates on the calendar to instantly compare your performance between those days. This makes it easy to analyze streaks, review the impact of specific trades or strategies, and measure your progress over custom periods—all without leaving the calendar view.
Simply click on two different days to highlight them. The comparison tool will automatically calculate and display the total profit or loss between your selected dates, helping you focus on what matters most for your trading review. This feature is perfect for end-of-week recaps, strategy testing, or quickly understanding the results of a new approach.
Get Started Today
Stop guessing about your trading performance. Our Daily Profit & Loss Calendar gives you the clarity you need to make better decisions, improve your process, and achieve your trading goals. See the Yearly Profit Calendar for a higher-level view, or contact us to see how this simple tool can transform your review process.
FAQ
Frequently Asked Questions
Answers to common questions about the Daily Profit & Loss Calendar.

It's a visual reporting tool that shows your daily trading results in a color-coded calendar, making it easy to spot trends and review your performance.
By making it easy to see your best and worst days, you can quickly identify what’s working and what needs adjustment—helping you build consistency and confidence.
Yes, you can switch between viewing total daily profit and the largest symbol profit/loss for each day. This helps you focus on the trades and symbols that matter most.
Absolutely. The calendar integrates with your trading journal, making it easy to connect your notes and analysis with your daily results.