Most Popular Trading Times: Discover Your Peak Activity
Every trader has unique rhythms�knowing when you�re most active can be the key to unlocking better results. Our Most Popular Trading Times report gives you a clear, visual breakdown of your trading activity by half-hour interval, so you can identify your peak periods and optimize your strategy for maximum impact.
With customizable time zones based on your account preferences, you�ll always see your activity in the context that matters most to you�no more guessing or manual conversions. Whether you�re comparing two specific days or analyzing broader trends, our tools make it easy to spot patterns and take action.
Compare your most active times across different dates or ranges, and see how your trading habits evolve. With interactive charts, flexible date selection, and clear visual cues, you�ll gain the insight you need to trade smarter at the end of every day.
Key Benefits
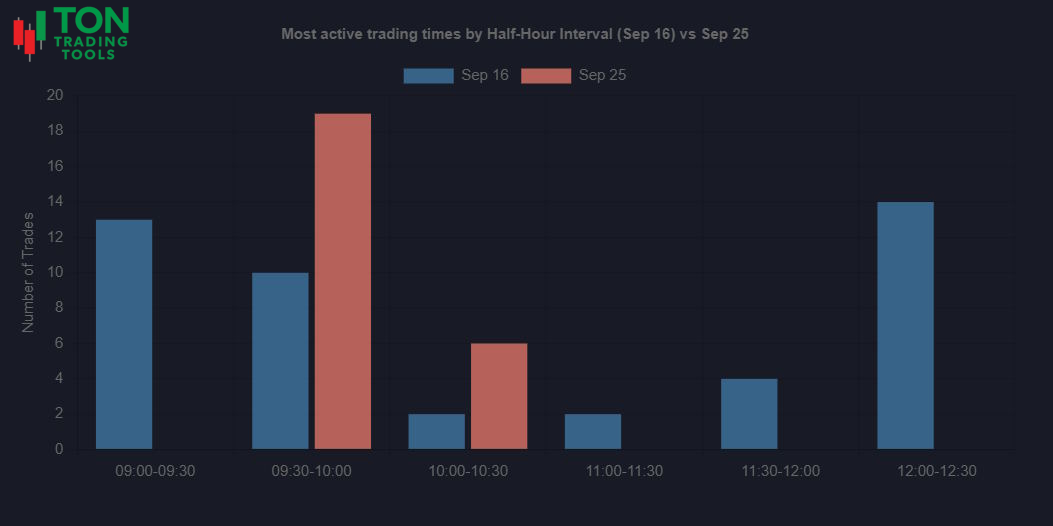
Visualize Your Trading Patterns
- See your most active trading times by half-hour interval
- Instantly spot peak periods and lulls in your trading day
- Compare activity between two dates or date ranges
- All times are displayed in your preferred time zone
Flexible Date & Range Selection
- Choose any two dates or select "Last 7 days" or "Last 30 days" for broader analysis
- Range selections show average activity per day for easy comparison
- Dropdowns make it simple to switch between periods
Advanced Features
- Interactive tooltips: hover to see exact trade counts for each interval
- Mobile-friendly, responsive chart design
- Automatic chart resizing for any device
- Clear legends and color coding for easy comparison
Why Analyze Your Trading Times?
Understanding when you�re most active helps you focus your energy where it counts. By identifying your peak trading windows, you can plan your day more effectively, avoid overtrading during slow periods, and make the most of your strengths. Our report gives you the data you need to build better habits and improve your results over time.
| Without Time Analysis | With Most Popular Times Report |
|---|---|
| Guesswork about peak activity | Clear visualization of your busiest intervals |
| Manual time zone conversions | Automatic adjustment to your preferred time zone |
| Hard to compare different days or ranges | Side-by-side comparison of any two periods |
| Missed opportunities to optimize routine | Actionable insights to refine your trading schedule |
How to Use This Report
- Select two dates or ranges to compare your trading activity
- Review the bar chart to spot your most and least active intervals
- Use tooltips to see exact trade counts for each time slot
- Adjust your trading plan to focus on your personal peak times
- All times are shown in your chosen time zone for clarity
Get Started Today
Stop guessing about your best trading windows. With the Most Popular Trading Times report, you�ll have the insight you need to optimize your schedule, build better habits, and trade with confidence. Experience the power of personalized, end-of-day analytics with Ton Trading Tools.
FAQ
Frequently Asked Questions
Answers to common questions about the Most Popular Trading Times report.

Yes! All times in the report are automatically adjusted to your preferred time zone, as set in your account preferences.
You can compare any two dates, or select "Last 7 days" or "Last 30 days" to see average activity per day for those ranges. This helps you spot changes in your trading habits over time.
Absolutely. The chart is responsive and automatically resizes for any device, so you can review your trading times on the go.
By understanding your peak trading times, you can focus your efforts during your most productive intervals, avoid overtrading during slow periods, and build a routine that matches your strengths.